The Word ‘Average’ Has More Than One Meaning
The average can mean mean, median or mode. Learn how each summarises a set of numbers and choose the measure that answers your question clearly.
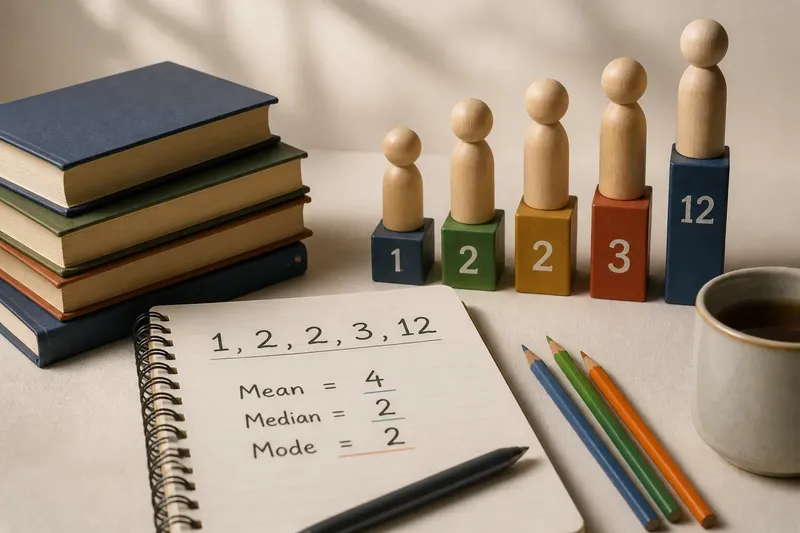
Ask for the average number of books on a shelf and you may get three defensible answers. The mean, median and mode summarise the same set in different ways, so the average depends on what you want the number to say. That distinction matters whenever one figure stands in for a group.
Consider this invented set of books read by five people in a month: 1, 2, 2, 3 and 12. The mean is 4, the median is 2 and the mode is 2. None is an arithmetic error. Each answers a different question about the same small collection.
What does the mean tell you?
The mean is what many people have in mind when they say “average”. Add all the values, then divide the total by how many values there are. For the book set, the total is 20 and there are five people, so the mean is 4 books per person.
This calculation treats every value as part of the total. The person who read 12 books contributes as much to the sum as each person who read 1, 2 or 3. The mean can be read as the amount each person would have if the total were shared evenly: five equal shares of 4 make 20.
That makes the mean useful when the total itself is the point. An organiser estimating how many books a group borrowed altogether might use the mean per person to describe the group’s overall volume. The mean also suits data where values are reasonably similar and no single value is far removed from the rest.
Its weakness is the same feature that gives it meaning: every value affects the total. In the example, four people read between 1 and 3 books, but the mean is 4 because one person read 12. Calling 4 the typical number would give a reader a misleading impression of an ordinary member of this group.
A mean can also be a value nobody actually had. That is not a flaw if the question concerns an even share or the group’s total divided by its size. It is less helpful if a reader wants to know what a person in the middle of the group did.
When is the median a better average?
The median is the middle value after the numbers are put in order. In the book set, the ordered values are already 1, 2, 2, 3 and 12. The middle observation is 2, so the median is 2 books.
To find a median, sort the values first. With an odd number of observations, take the single middle observation; it has the same number of observations before and after it. With an even number, take the mean of the two middle observations. For instance, the median of 1, 2, 3 and 12 is 2.5. The median need not be one of the observations, but it still marks the centre of the ordered list.
The large value of 12 does not shift the median away from 2. It remains one high entry at the end of the list, rather than adding its full weight to a total that determines the summary. This makes the median a sensible choice when a distribution has a long tail or a few unusually high or low values, and the question is what a central case looks like.
That is why median household income can be more informative than mean household income when a small number of very high incomes pull the mean upwards. The median identifies the middle position: half the observations are at or below it and half are at or above it. For an odd-sized set, the middle observation belongs to both descriptions; it is not necessary to place it exclusively on either side. The median does not describe how much money households have in total, or how far apart their incomes are.
The median is not automatically the “more honest” average. If high values matter to the question, setting their size aside can hide useful information. For a budget that must cover total spending, for example, the mean may matter precisely because large purchases count heavily.
What can the mode reveal?
The mode is the value that appears most often. In the book set, 2 appears twice while every other number appears once, so the mode is 2. It tells you which reported number is most common.
Mode can be useful for categories that cannot sensibly be added or ordered. If a group chooses among tea, coffee and water, the most popular drink is the mode. Calculating a mean of those labels would be nonsense, and arranging them from smallest to largest would not help. The mode also works with numerical values: it can identify the most common shoe size, bus route or number of books read.
A set can have more than one mode if several values tie for the highest frequency. It can also have no useful mode when every value occurs once. In the book example, the mode captures the repeated answer but leaves the other values out. It cannot say whether they are close to 2 or far away.
So the mode suits a question about the most frequent choice, not necessarily one about the group’s centre. A shop deciding which colour appears most often in customer orders may care about the mode. Someone estimating the total quantity ordered needs another measure, because frequency alone does not account for how many items each order contains.
Which average should you choose for your question?
Start by asking what the summary is meant to preserve: the total, the middle position or the most common value. Then consider how the numbers are distributed and whether a single unusual value should carry much influence. These choices are easier to defend when the measure is named rather than left as the vague word “average”.
- Choose the mean when each value should contribute to a total and an even-share interpretation is useful. If one value is much higher or lower than the rest, then report the mean with that context or consider also giving the median.
- Choose the median when you need a central position that is less affected by extreme values. If the total or the size of those extremes matters, then report the mean or the relevant values as well.
- Choose the mode when the most frequent value or category is the point of interest. If values tie or all occur once, then state that there is no single useful mode rather than implying a clear favourite.
- Report more than one when the data are uneven and one summary would conceal a meaningful feature. If each measure answers a different part of the question, then name each one and explain its purpose.
- Check the ordered list before calculating the median. If the number of observations is odd, then identify the single middle observation; if it is even, then average the two middle observations.
- Check what was counted before interpreting any average. If relevant people or items are missing, then describe the group actually included instead of treating it as the whole population.
Imagine a neighbourhood group records these invented monthly book counts: 1, 2, 2, 3 and 12. First, add them to get 20 and divide by the five people; the mean is 4. Next, the values are already ordered, and the third observation is 2; the median is 2. Finally, count repetitions: 2 occurs twice and each other value once, so the mode is 2. If the group wants an even-share figure for the total, 4 answers that question; if it wants the central or most frequent count, 2 does. The trade-off is that the mean reflects the high count of 12, while the median and mode do not describe its size.
In practice, a short explanation alongside the figure often does more work than a bare number. “The median was 2, with one value of 12” gives a reader a sense of the distribution that “the average was 4” does not. Likewise, a mean paired with the total can make clear why it was chosen. The right measure is the one that answers the stated question without implying that all the values clustered around it.
What should you check before trusting an average?
Does the mean fit the scale of the data?
For measurements such as length or time, arithmetic usually has a clear interpretation. For categories such as colour or type of transport, a mean is not meaningful unless the labels encode a real numerical quantity. A code assigned to a category does not turn it into a measurement.
Are all relevant observations included?
A summary can change if people or items are missing, or if the group was selected in a way that excludes relevant cases. Check what was counted and what the group represents. A precisely calculated number can still describe the wrong set.
Are the values clustered or spread out?
Two groups can share the same mean while having very different patterns. One might have values close to the mean; another might combine low values with much higher ones. A range or a simple list of values can add context when the spread affects the point being made.
Would one sharply changed value alter the result?
If a single entry has a large effect on the mean, the median may better describe the centre, while the high or low entry may still deserve separate mention. If the question concerns the total, that entry may be essential rather than distracting. The purpose decides which interpretation is useful.
Why is “average” not enough on its own?
In conversation, “average” can be a convenient shorthand. In a report, a comparison or a claim about what is typical, it leaves a reader guessing which calculation was used. Name the mean, median or mode, and say what was counted when that is not obvious.
For the invented book set, the mean is 4, the median is 2 and the mode is 2. Each is a valid summary, but only in answer to its own question: equal share, middle position or most frequent value. When you see an average, ask not only how it was calculated but what the number was chosen to represent.