Contour Lines: A Hill Drawn in Rings
Learn to read contour lines on a map: use intervals, spacing and bends to identify elevation, steep ground, valleys and ridges with greater confidence.
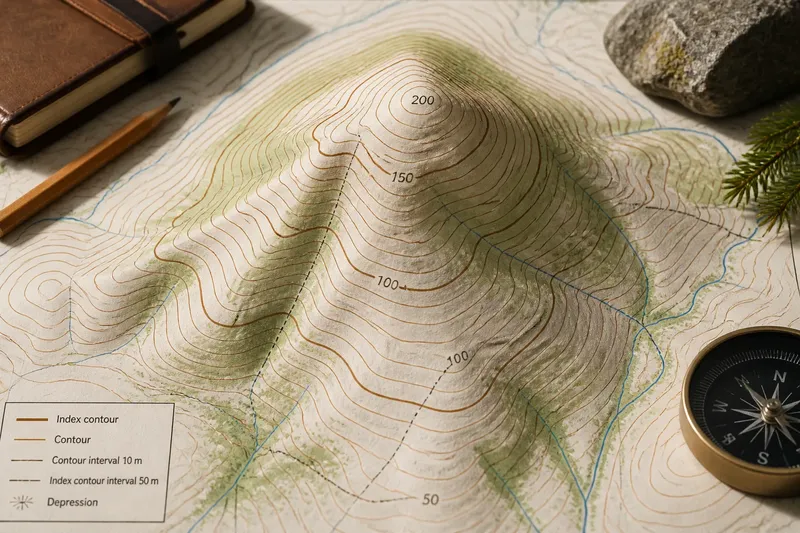
Contour lines on a map show a hill’s shape without showing the hill itself. To read contour lines, start with the interval between them, then follow their spacing and bends to see where the ground rises, falls or steepens.
What does each contour line represent?
Imagine cutting a hill into horizontal layers, like a stack of broad, uneven discs. Each cut would meet the ground along a line. A contour line draws one such meeting line on a flat map, connecting places at the same elevation above the map’s chosen reference level.
Walking along a contour would keep your elevation broadly constant, although the line may bend around gullies, ridges and other terrain. Moving from one contour to another means moving up or down. The map does not show the land’s vertical face; it translates that shape into a pattern of lines.
Contours are not a picture of every bump. Small features may be absent or simplified, depending on the map’s scale and purpose. Treat them as a useful model of the ground, not a promise that every fold will appear.
Where do you find the contour interval?
Before interpreting the lines, check the legend or map margin. The contour interval is the vertical difference between neighbouring contour lines. A map might state that ordinary contours mark rises of five metres; the actual interval varies, so do not infer it from how the lines look.
Some contours carry printed elevation labels. These index contours are often drawn more heavily than ordinary ones, making them easier to follow and providing reference points for the lines between them. If labelled contours show 100 and 150 metres and the stated interval is ten metres, the intervening lines step through the elevations in order. Check the map’s own labels and interval rather than treating this illustration as a universal pattern.
The interval matters because spacing describes slope only when the vertical difference is known. Close lines on one map may represent a different rise from close lines on another. The legend gives the vertical change; the pattern shows the shape.
How do spacing and loops show the land?
Once you know the interval, compare the distance between neighbouring lines on the map. If they sit close together, the ground gains or loses that fixed elevation over a short horizontal distance: the slope is steep. Farther-apart lines indicate a gentler slope.
Even spacing usually suggests a fairly even slope. Lines that crowd together in one area and spread out in another show that the slope changes. This is a visual comparison, not a direct measure of how difficult a crossing would be; the map may omit local conditions and small terrain features.
Closed loops commonly mark a hill or a depression. On a hill, elevations increase towards the centre. In a depression, they decrease towards the centre; some maps use short inward-pointing marks, called hachures, to distinguish it from a hill. Read the printed heights or marks rather than assuming every ring rises inward.
Say you find a closed loop labelled 200 metres, an inner line, and a contour interval of ten metres. If the inner line is unlabelled and the loops rise towards the centre, you can infer that it represents 210 metres. The clue is the increasing elevation, not the rounded shape alone.
How do you read a ridge, a valley and a spur?
Where contours cross a valley, they form a V or U shape pointing uphill, towards higher elevations. The valley runs the other way, downhill from the point of the V. A stream may occupy the low ground, but contours can show a valley even when no watercourse is marked.
On a ridge, contour bends point downhill, away from higher ground. A spur is a smaller finger of land extending from a ridge. Its contours also bend outwards, but the shape is usually narrower and lies between neighbouring valleys. Elevation labels help distinguish these forms when the bends are subtle.
A saddle is a low pass between two higher areas. On the map it can look like a narrow dip between two sets of rising contours. It is neither a summit nor a valley bottom, but lower ground connecting higher slopes.
What should you check before interpreting contour lines?
Do contour lines cross one another?
Ordinary contour lines do not cross: a point on the ground cannot have two different elevations. They may meet or overlap in unusual representations of an overhanging cliff, but most maps simplify such terrain. If lines appear to cross on a normal landform, check the nearby symbols and map detail before interpreting the shape.
Does a larger loop always mean a higher hill?
No. A loop’s size describes the land’s horizontal extent, not its height. Use elevation labels, the contour interval and the direction in which heights change to judge whether its centre is higher or lower.
Can contour spacing tell you the exact slope angle?
Not by itself. To estimate an angle, you need both the vertical rise and the horizontal ground distance: slope angle is the inverse tangent of rise divided by horizontal distance. The interval provides the rise between adjacent contours; the map scale converts their measured separation on the page into ground distance.
Say you are reading a map with a hypothetical scale of 1:25,000 and a contour interval of ten metres. You measure five millimetres between neighbouring lines on the map. At that scale, the ground distance is 125 metres; the rise-to-run ratio is 10 divided by 125, or 0.08. Taking the inverse tangent gives an angle of about 4.6 degrees. This is an estimate for that section of slope, not a description of every point between the contours.
Why are some contour lines darker or labelled?
Heavier index contours divide the pattern into easier-to-read groups, and their printed elevations provide reference points. Ordinary lines between them carry intermediate elevations at the interval stated in the legend.
How can you build a mental picture from the map?
Choose a small area and follow its contours one at a time. Find a labelled line, note its height, and move to adjacent lines using the interval. Watch for loops, changes in spacing and V-shaped bends; then describe the shape plainly: a rounded rise, a steep face, a shallow valley or a ridge with a spur.
It can help to trace a line with a fingertip while keeping the elevation labels in view. A contour circling a hill returns towards itself at a higher elevation, while one bending into a valley points towards higher ground. The pattern becomes easier to picture when you treat each line as a level slice rather than as a drawing of a route.
For contour lines, combine three clues: the interval gives the vertical change, the spacing suggests steepness, and the bends show the land’s form. If you need an angle, use the map scale and calculate from a measured horizontal distance rather than relying on appearance alone.
When two interpretations seem plausible, return to a printed elevation and trace outward from it. A confirmed height can settle the direction of the surrounding pattern, much as a labelled rung makes sense of the rest of a ladder.